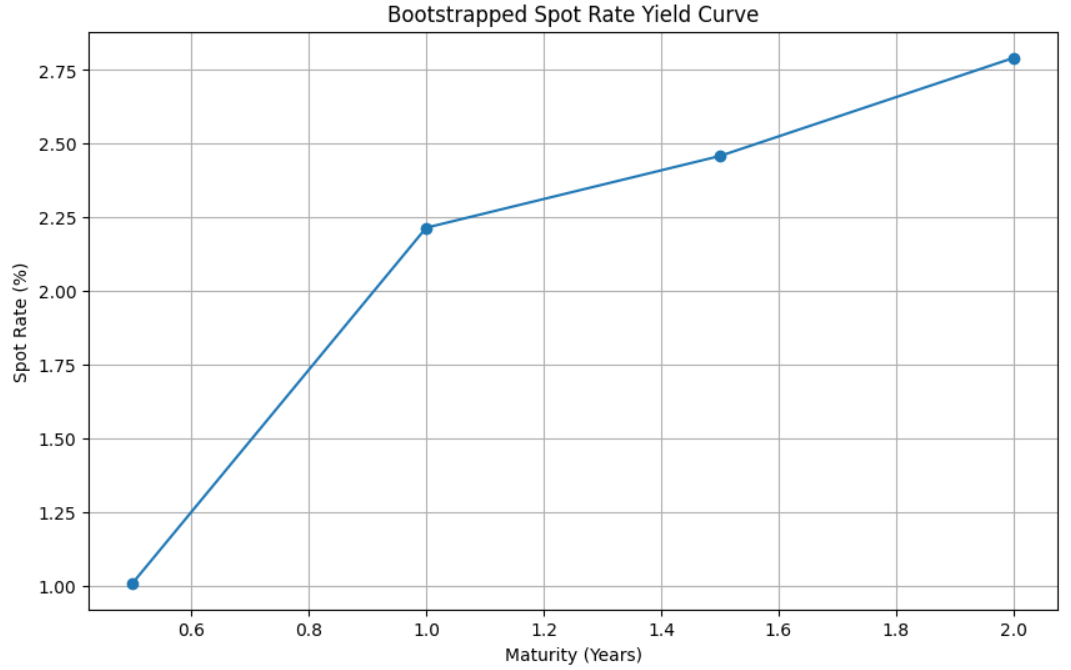
What is a Spot Rate Yield Curve?
The spot rate yield curve is a graphical representation that shows the relationship between spot rates (yields of zero-coupon bonds) and their maturities. It's an essential concept in bond valuation and risk management, helping investors understand the time value of money over different periods.
The Bootstrapping Method
One common method to construct the spot rate curve is bootstrapping. This technique uses the yields of existing Treasury securities to determine a series of spot rates. Essentially, we start with the shortest-term rates and sequentially build up to longer-term rates.
Implementing in Python
To demonstrate, we'll use Python with libraries like NumPy and Matplotlib. We’ll also use numpy_financial for financial calculations. Here's a step-by-step guide:
Step 1: Prepare Your Environment
First, ensure you have Python installed. Then, install necessary libraries:
pip install numpy matplotlib numpy-financial
Step 2: Define Your Data
We begin with sample bond data. Each bond has a maturity, annual coupon rate, and market price.
bonds = [
    ['6-month zero-coupon bond', 0.5, 0, 99.5],
    ['1-year coupon bond', 1, 2, 99.8],
    ['1.5-year coupon bond', 1.5, 2.5, 100.1],
    ['2-year coupon bond', 2, 3, 100.5]
]
Step 3: Calculate Zero-Coupon Yield
For zero-coupon bonds, the yield is straightforward to calculate:
def zero_coupon_yield(price, maturity):
    return (100 / price) ** (1 / maturity) - 1
Step 4: Bootstrap the Yield Curve
Now, let’s use bootstrapping to calculate the spot rates:
import numpy_financial as npf
import numpy as np

def bootstrap_yield_curve(bonds):
    spot_rates = np.zeros(len(bonds))
    for i, bond in enumerate(bonds):
        name, maturity, coupon_rate, price = bond
        cash_flows = np.zeros(int(maturity * 2))
        if coupon_rate == 0:
            spot_rate = zero_coupon_yield(price, maturity)
            spot_rates[i] = spot_rate
            continue
        semi_annual_coupon = coupon_rate / 2
        cash_flows[:] = semi_annual_coupon
        cash_flows[-1] += 100
        discounted_npv = 0
        for j in range(len(cash_flows)):
            if spot_rates[j] != 0:
                discounted_npv += cash_flows[j] / (1 + spot_rates[j] / 2) ** (j / 2)
        adjusted_initial_investment = -1 * (price - discounted_npv)
        adjusted_cash_flows = [adjusted_initial_investment] + cash_flows.tolist()
        irr = npf.irr(adjusted_cash_flows) * 2
        spot_rates[i] = irr
    return spot_rates
Step 5: Plot the Yield Curve
Finally, visualize the yield curve using Matplotlib:
import matplotlib.pyplot as plt

spot_rates = bootstrap_yield_curve(bonds)
plt.figure(figsize=(10, 6))
plt.plot([bond[1] for bond in bonds], spot_rates * 100, marker='o')
plt.title('Bootstrapped Spot Rate Yield Curve')
plt.xlabel('Maturity (Years)')
plt.ylabel('Spot Rate (%)')
plt.grid(True)
plt.show()
Conclusion
Building a spot rate yield curve is an essential skill in finance. This Python approach offers a practical way to understand market expectations for future interest rates. By mastering these techniques, you can gain valuable insights into bond valuation and the overall interest rate environment.


